Target Digital Network Analyst Challenge
The Laboratory of Analytical Sciences (LAS) is an arm of the National Security Agency partnering with academic institutions and industry to advance technology for the U.S. Intelligence Community (IC). LAS approached our team to create a new internal enterprise application for a future feature upgrade for data scientists at the senior policy level.
Client
The Laboratory of Analytical Sciences
Role
UX/UI Designer
Team
Parinita Das, Vaishanvi Parni

Process and Timeline
The entire process took ten weeks and involved multiple ideation sprints, each followed by valuable feedback from both our users and sponsors.
Throughout the project, I collaborated closely with the team in every phase, from ideation to user feedback sessions, ensuring we maintained a user-centered approach. Alongside these responsibilities, I taught my teammates design systems, Figma, and key design principles to elevate our collaborative work.
Research Question
How might the design of an interface use the affordances of AI to enable Target Network Analysts (TDNAs) to efficiently and knowledgeably analyze data as it moves through the global communication network?
Persona
Miguel | Senior TDNA
Miguel is a senior Target Digital Network analyst at BGIA.
His daily work deals with understanding current intelligence topics worked by BGIA’s Zendian Office as well as acquiring access to data to meet the intelligence needs.
His work can cover a wide range of data types and his priorities frequently change as events occur. Miguel plans and oversees his team’s activities, but is not a supervisor.
“As Is” User Journey
Using the given scenario and persona profile, our team spent hours and nights in the studio trying to empathize with Miguel and understand what a day in the life of a Senior TDNA would look like.
We were asked to use specific data points from his workday, so we came up with all kinds of data his team is trying to find, including random IP addresses, cell tower numbers, and drone makes. All of this was done to make this User Journey as realistic as possible, to gain a better understanding, and to more fluently communicate with analysts during the feedback sessions.
Identified Pain Points
After we analyzed Miguels work day and defined the flow of his workday, we concluded the following pain points we wanted to solve:
Inability to identify gaps in task flows of his teammates
Getting interrupted while running his own queries
Inefficiency of information search of TC Hub
Solution:
SPINE
Analyze. Mentor. Document.
Leverage AI to enhance mentoring process and automate documentation.
From Low-Fi to Hi-Fi
This project required many iterations, involving the generation of new ideas and the elimination of old ones. Some concepts, however, remained very similar to the initial ideas. Critiques from analysts, professors, and peers brought necessary changes every week.
Low-Fidelity
Mid-Fidelity
High-Fidelity
Low-Fidelity
Rapid prototyping followed by User testing and feedback
Mid-Fidelity
Exploring tool architecture and data visualizations
High-Fidelity
Refining and animating final prototype while conducting final testing
Key Features
Goal Setting
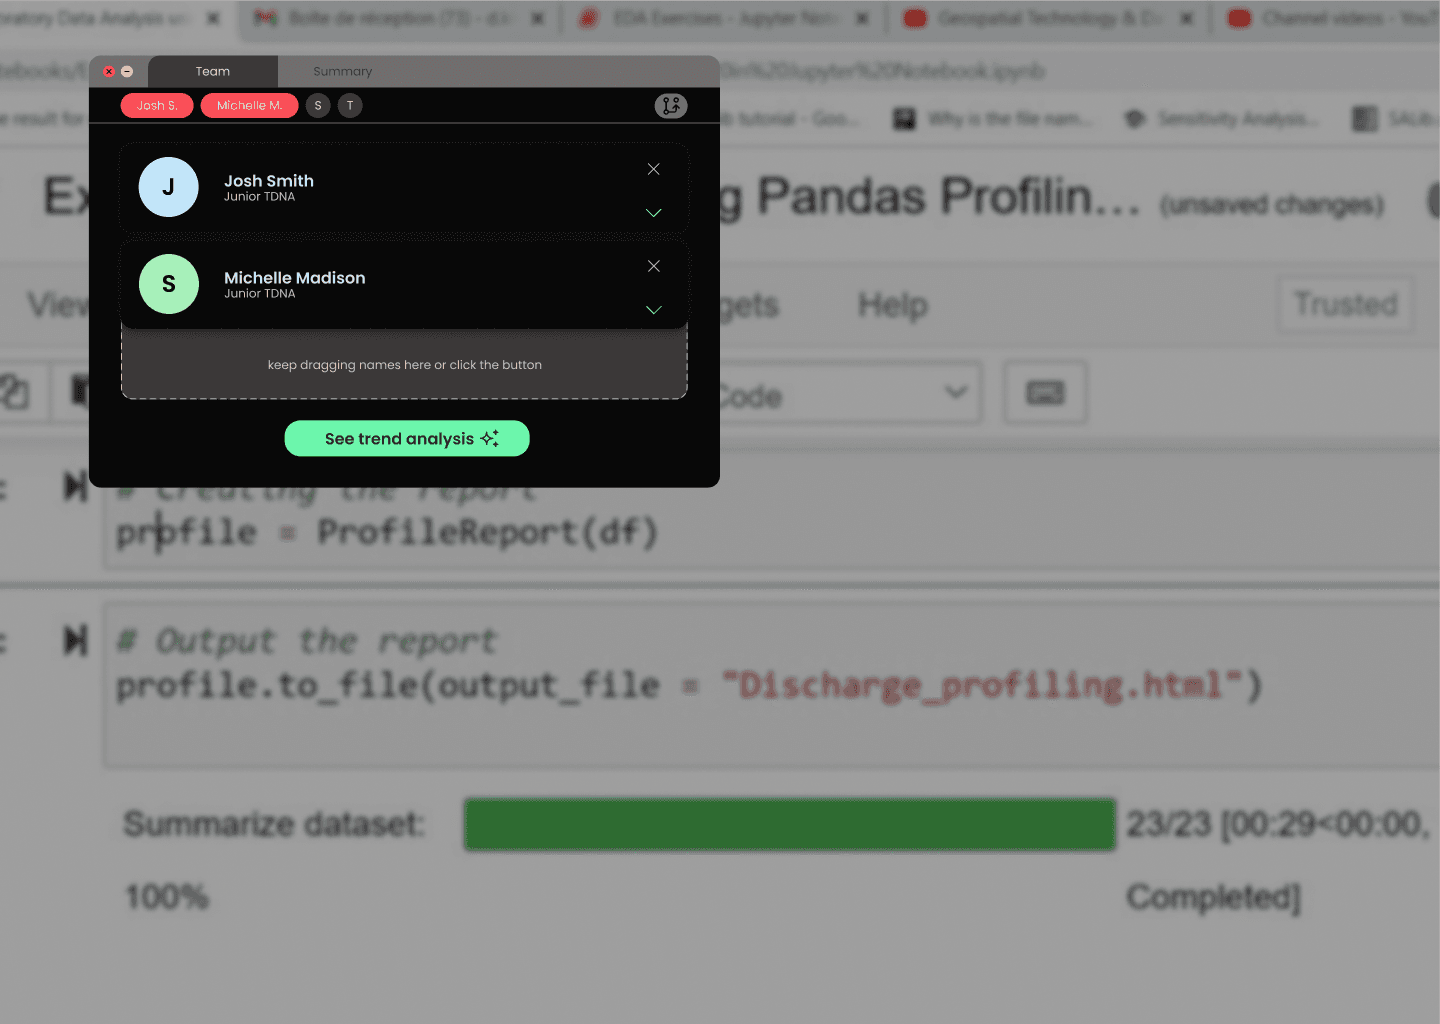
AI learns from the Senior TDNA's input to further optimize queries and identify outliers.
Implement AI-driven suggestions for datasets to initiate the query process, with flexibility for TDNAs to incorporate their own preferences.
Modifying Query
Ability to adjust the time, date, and area range in the prompt by toggling the slider.
Those will get substituted in a prompt and once the analyst is satisfied with the query, they can paste it into the analytic software.
Spine
A repository that documents analyst’s investigative journey sequentially.
It can be accessed by all team members at any point of the day via “Spine” icon in the upper right corner of the window.
Demo Video
Thank you for your time!
To learn more, read this article by NC State about LAS and the project.
Read the Article


